True Impact
To access the True Impact report for a message:
-
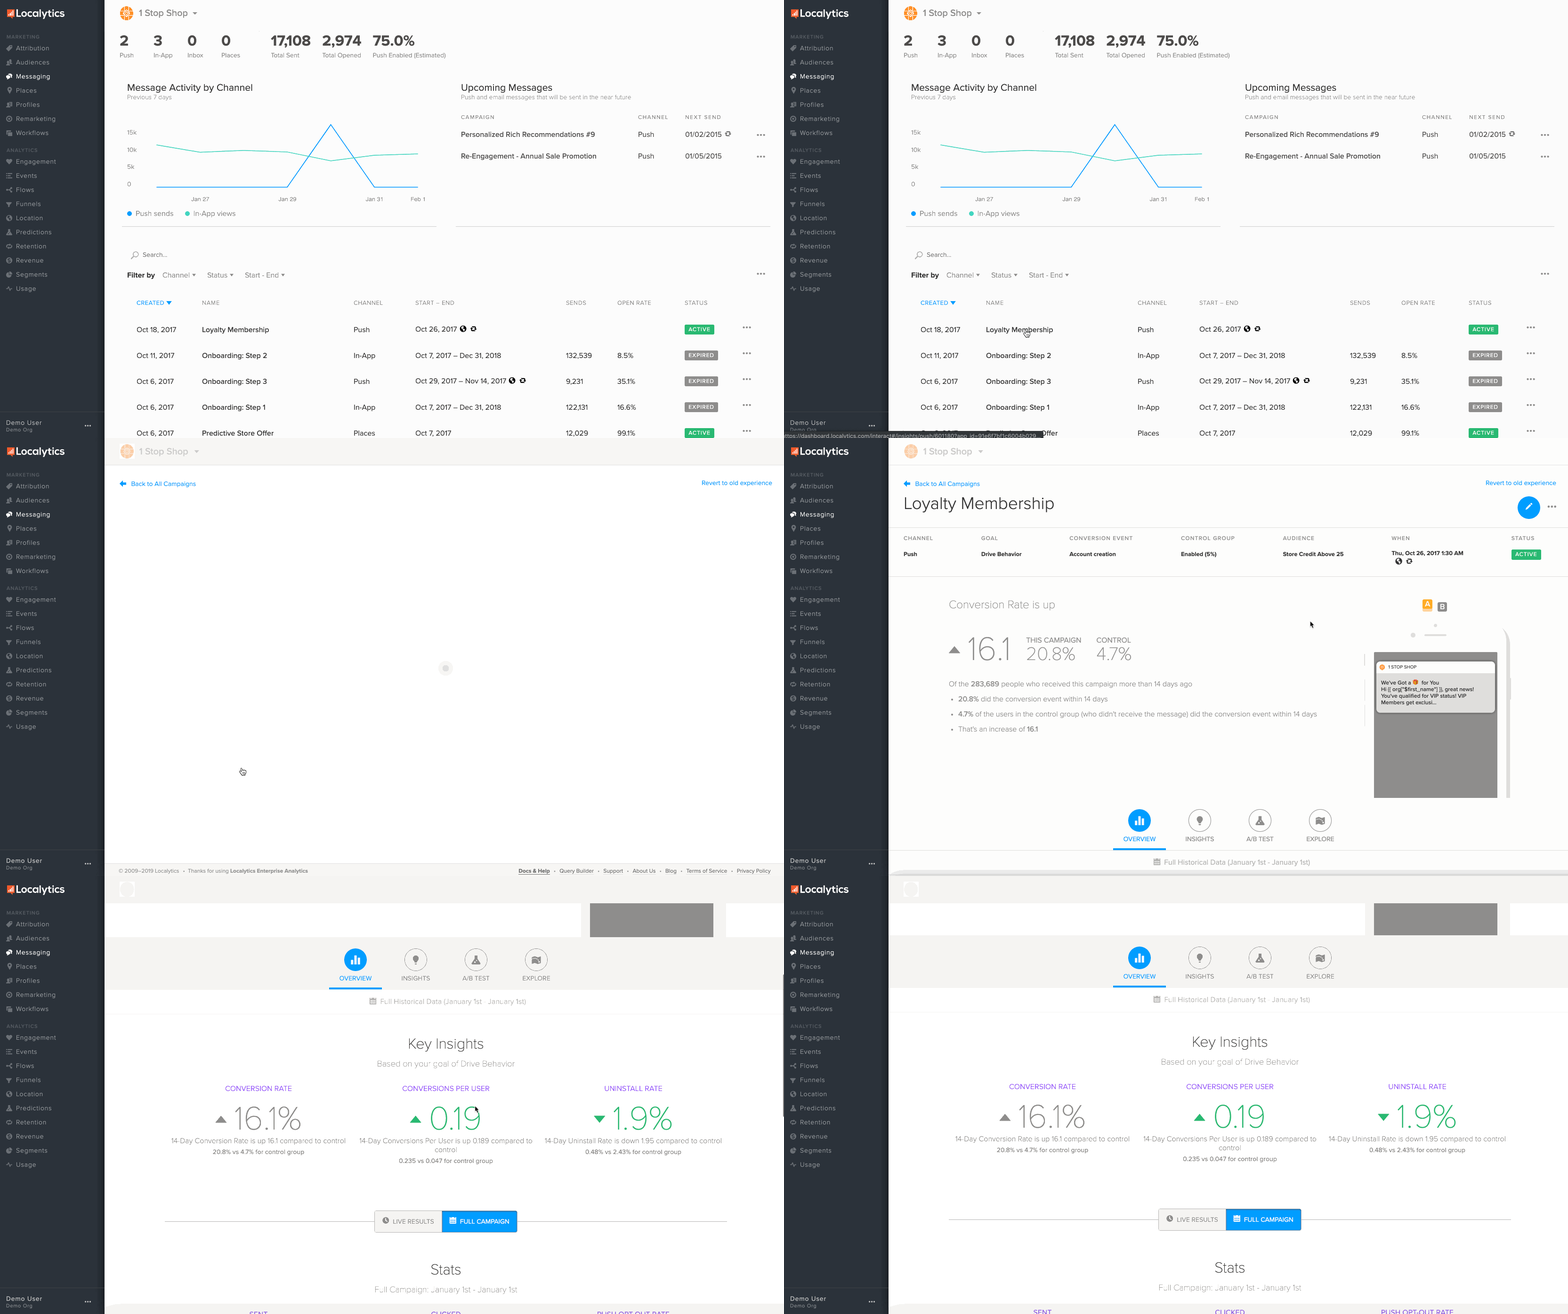
Go to Marketing in the left pane and select Messaging.
-
Select the message from the Messaging table.
Note: True Impact reports are not available for messages with Draft status.
The True Impact report displays basic metrics, such as sends, opens, and conversions, plus additional insights into how your messages drive changes in user behavior.
Some use cases might be:
- Consume at-a-glance Hero insights around specific message performance.
- See positive as well as adverse downstream effects of your message.
- Dive into deeper insights to see other commonly observed user behaviors.
Each True Impact report will be personalized your message type, goal, length, and user experience—so every True Impact report is different. There are a few metrics that span across each of the message types:
-
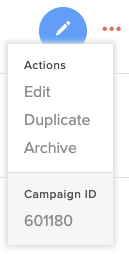
To edit, duplicate, or archive your campaign, select the ellipsis (...) in the upper-right corner. You will also see the campaign ID.
Message summary
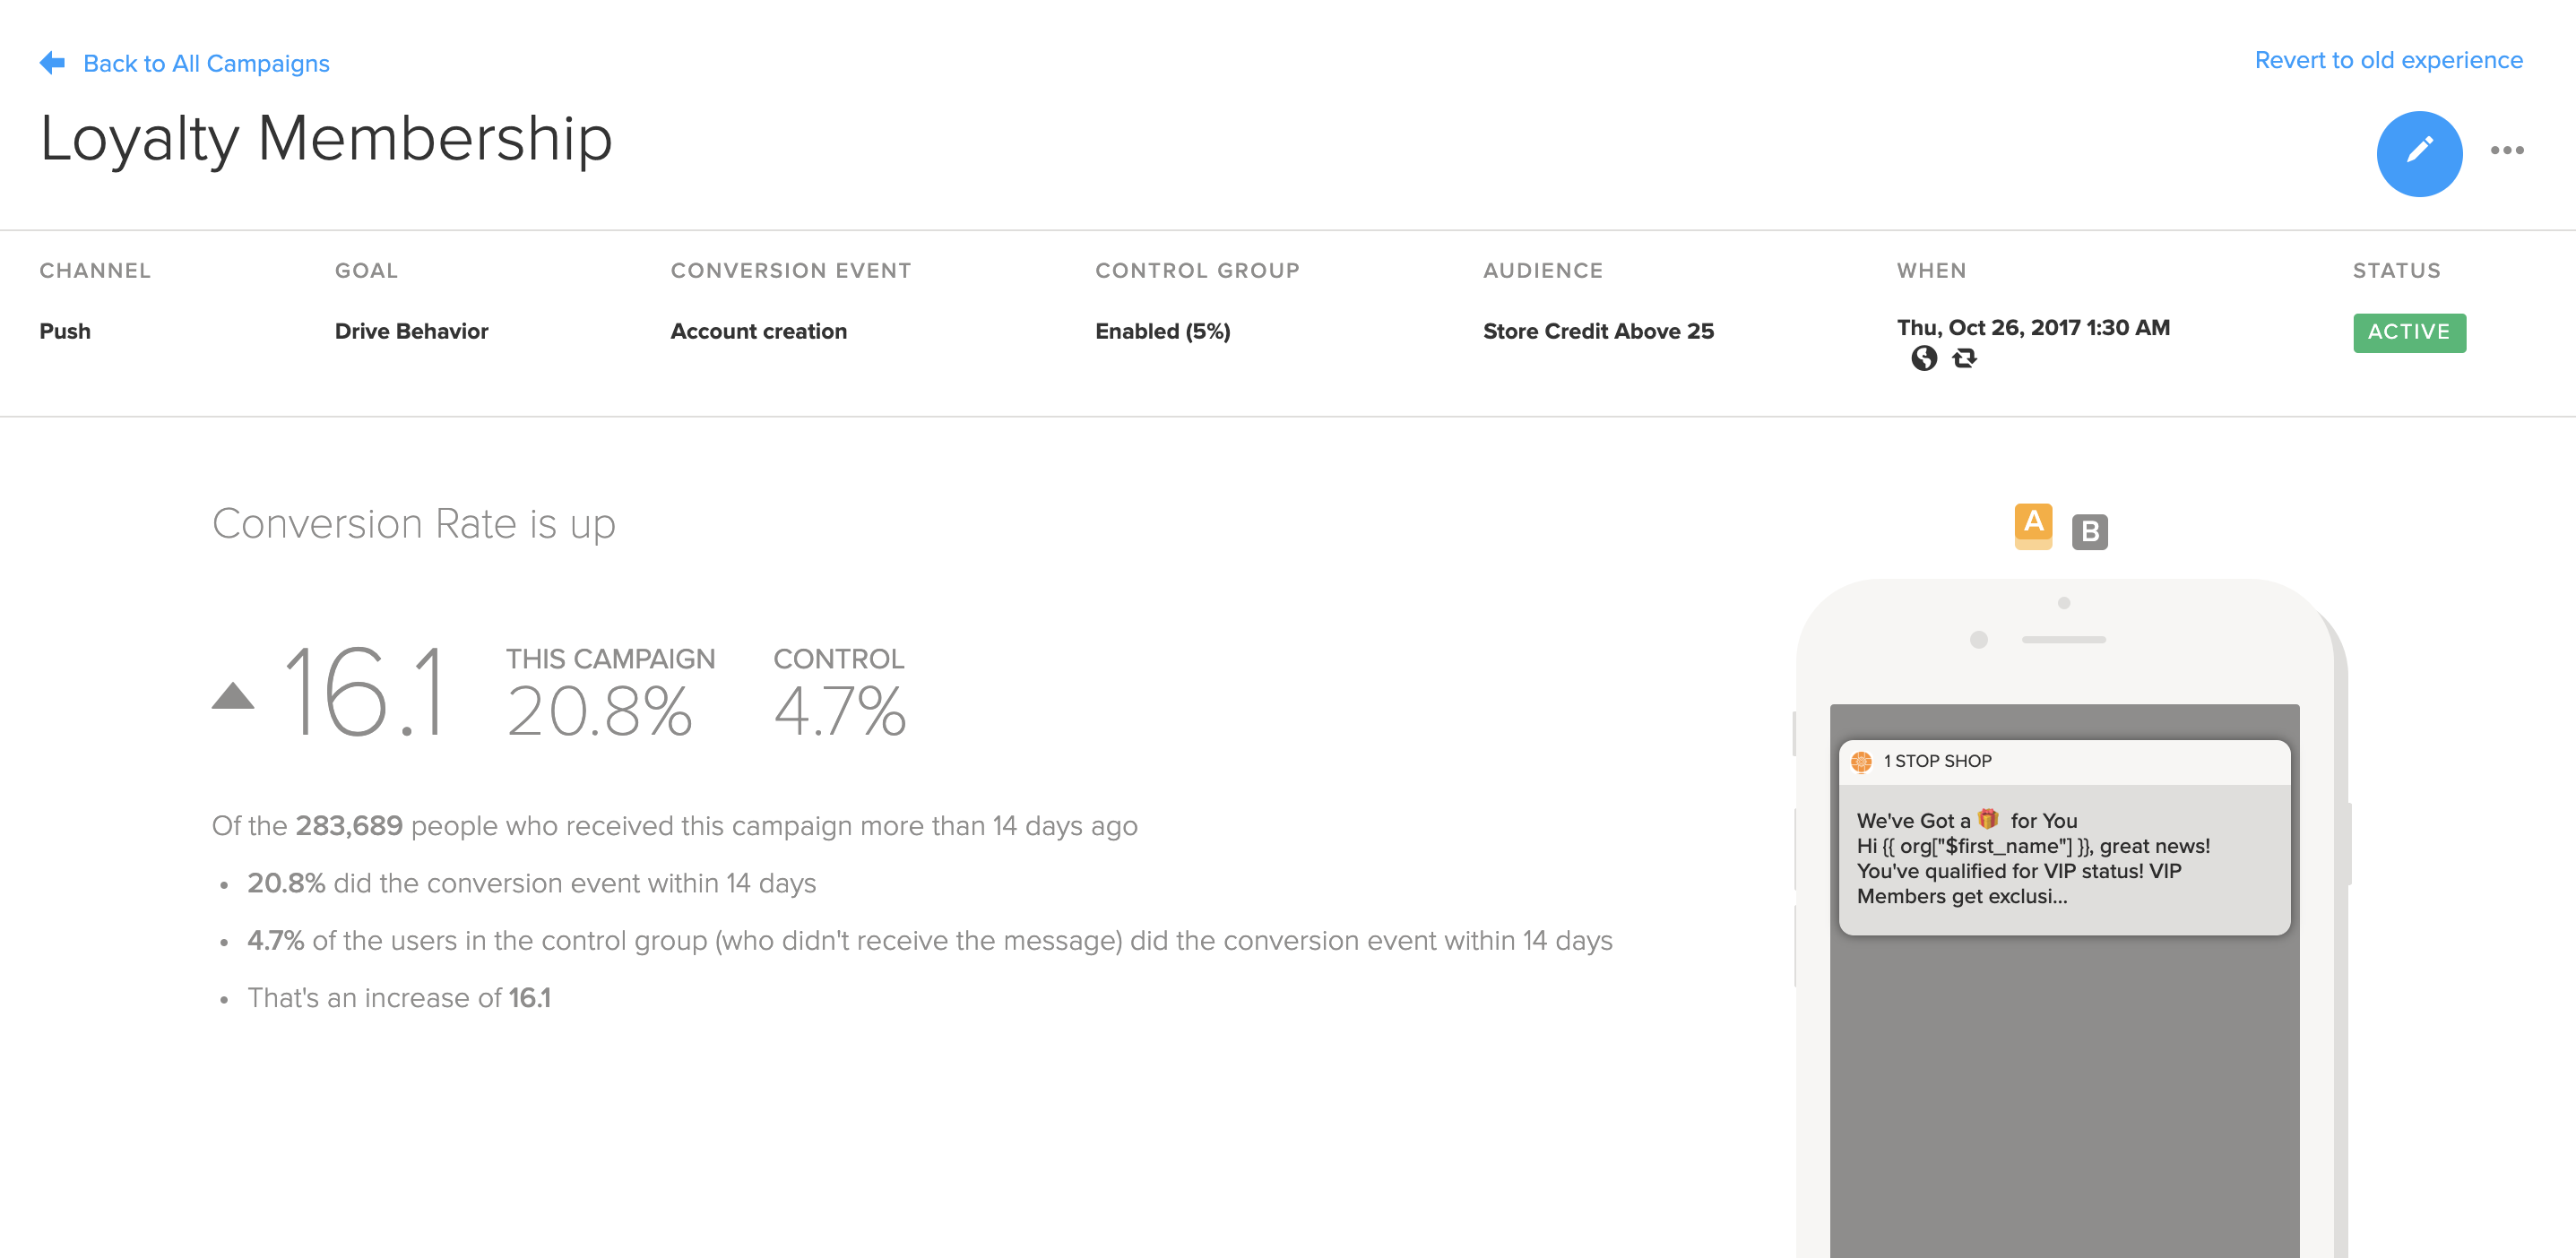
The top part of your True Impact report is the message summary. Here you'll find high-level information about your message, some hero insights, and a preview of the message.
Message information
At the top of the True Impact report, you'll see top-level information about your message.

| Category | Description |
|---|---|
| Channel | The type of message: push, in-app, inbox. |
| Goal | The goal you set during the building phase: activate, drive behavior, nurture, monetize, re-engage, or notify (point to the name for more information). |
| Conversion event | The event that measures the success of the goal (if you've applied a filter, point to the filter icon for more information). |
| Control group | If you enabled a control group, you'll see the % here. |
| Audience | The audience you chose to send the message to (we'll only show a name here if you've chosen from a saved audience—if you built one in the message builder, it is listed as "custom"). |
| When | The date the campaign was launched and potentially finished (point to the icons for more information). |
| Status | Active or expired |
Hero insight
The Hero insight is a metric that gives you some indication of how successful your message has been.
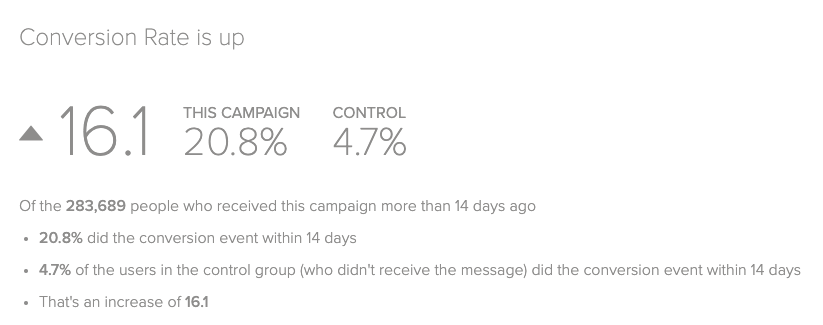
The information shown in the Hero insight is determined by the goal, which you specified when you built your message. For example, if the goal of your message was Monetize, then the Hero insight would show you details around how the message is driving changes in Revenue Per User.
Depending on the performance of your message, this metric (and all other metrics in True Impact) will be red, green, or gray. These colors indicate statistically significant negative change, statistically significant positive change, and no significant change, respectively.
If it has been less than 48 hours since your message went live, you might not see a Hero insight. Don’t worry, everything is still working properly! For more information, see Live Results.
Message preview
If available, you'll see a preview of your message.
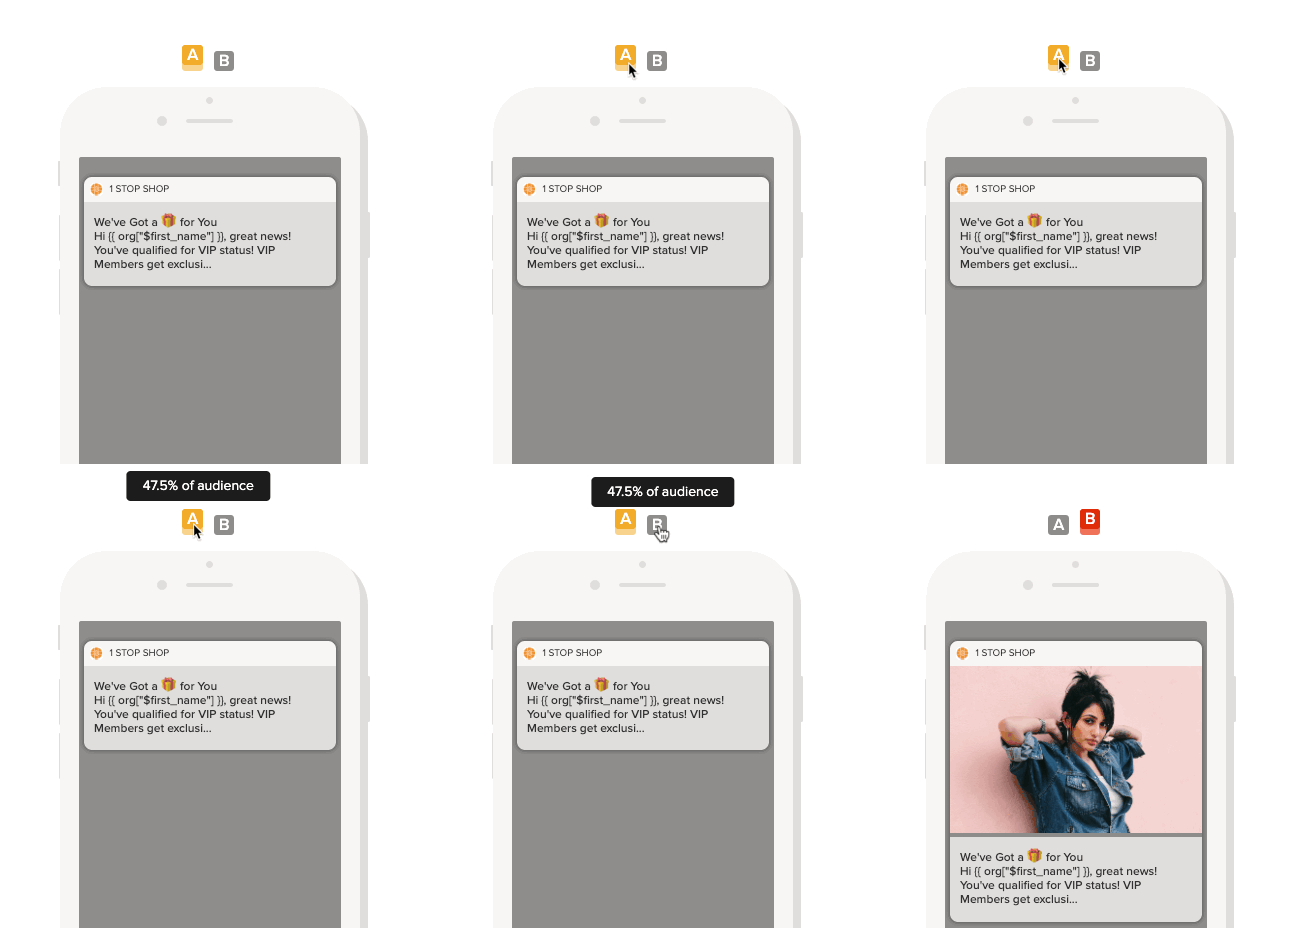
If you are running an A/B/n test:
- Select the letters above the preview to view each message version.
- Point to a letter to see the percentage of the audience who received that message.
Tip: Selecting a different message version in the preview doesn’t change any of the metrics seen on the rest of the True Impact report. If you want to see metrics for a specific creative version, see Insights and A/B Test.
Navigation bar
The navigation bar accesses the four sections of the True Impact report.
| Section | Description |
|---|---|
| Overview |
Consolidates all of your basic message metrics in one place. It also calls out a few key insights from your message, which you can explore further in the Insights section. |
| Insights |
Provides the details for a deeper understanding of how your message has driven changes in user behavior. |
| A/B Test | If your message includes an A/B/n test, displays a side-by-side comparison how of your different creatives performed. |
| Explore | Lets you uncover insights for users who received your message and performed different behaviors. |
Overview
The Overview section gives you a high-level summary of how your message is performing.

Here you'll see insights related to the goal you chose—for example, conversion rate, revenue per user, and uninstalls. Again, keep in mind the color code: green for positive change, red for negative, and gray for no change.
The Overview section consolidates all the information marketers care about most into one place. This allows you to quickly and easily check on the health of your message.
Key insights
In Key Insights, you will find several metrics that give you an idea of how your message has driven changes in user behavior. Point to any of the numbers for a deeper explanation.

The metrics shown depend on the goal of your message. For example, if your message's goal was Monetize, then you will find Revenue per User and Number of Paying Users as two of the metrics displayed in the Key Insights section.
The metric on the right is the metric that was most negatively impacted by the message. It highlights any unintended consequences of the message.
Live results vs. full campaign
Select Live Results to see data from the past 48 hours, updated every 5 minutes, or Full Campaign to see more metrics, updated every 24 hours.

You selection determines what data is shown in the Stats and Trends sections.
If you select Live Results, you will be shown data from the past 48 hours, updated every five minutes. In contrast, if you select Full Campaign, you will see more metrics, but they are only updated every 24 hours.
Live Results is a great way to take a look at the initial performance of a message in the minutes and hours after it goes live, while Full Campaign is the better choice for getting an overall sense of how your message is doing.
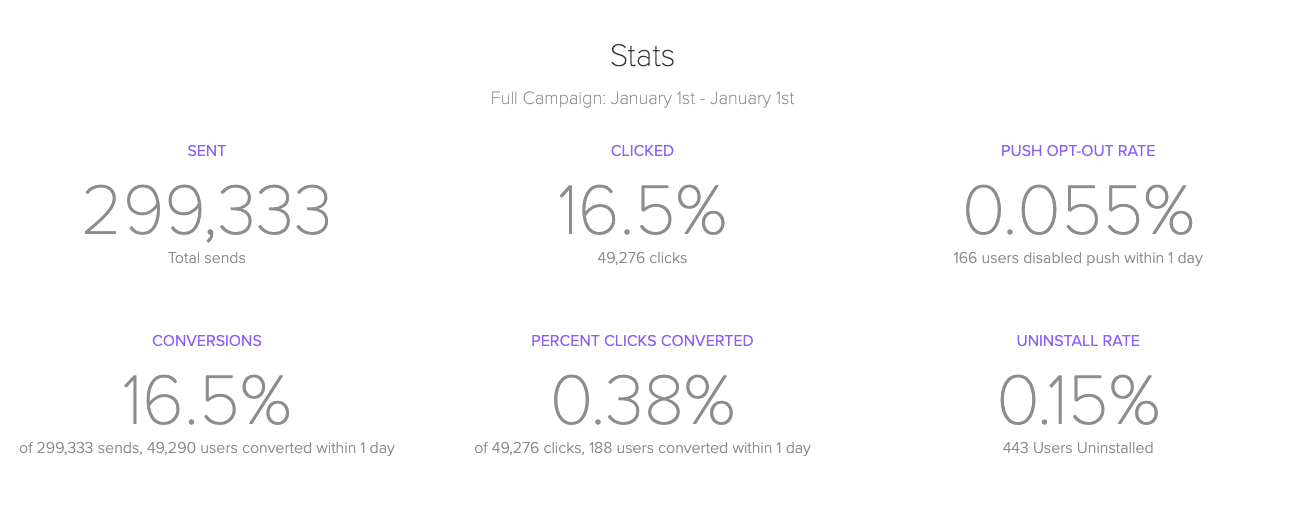
Stats
In Stats, you will find a variety of standard message metrics, such as sends, clicks, and conversions. Stats is where you should turn to get a sense of how your message is performing.
Note: If you're viewing Live Results, this section is labeled Recent Activity.
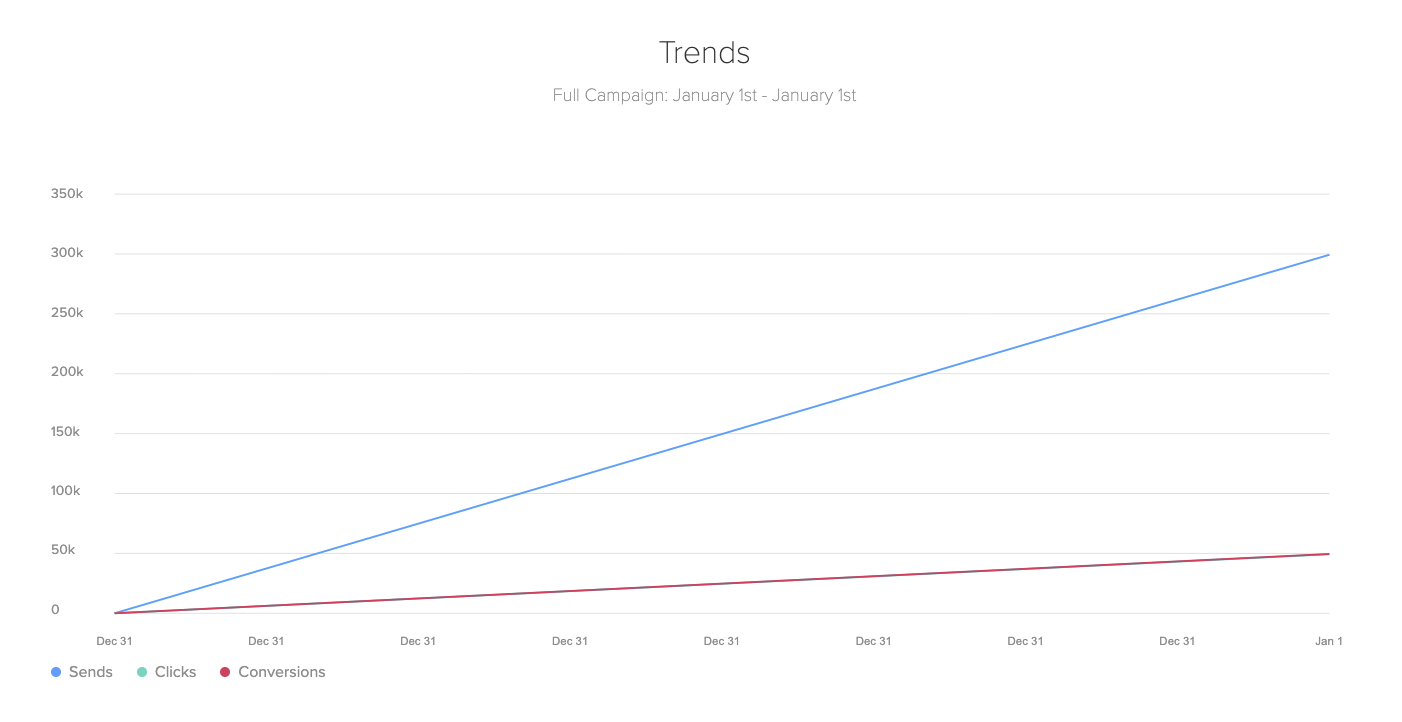
Trends
Trends gives you a sense of what’s been happening with your message over time. It shows you how sends, opens, and conversions have changed over time. Pointing to different parts of the chart will give you more insights—for example, isolating particular metrics or viewing the exact number of sends on a given day.
Insights
The Insights section helps you understand the details of how your message changed user behavior. The metrics in the Insights section are split into three groups: Engagement, Conversion, and Revenue.
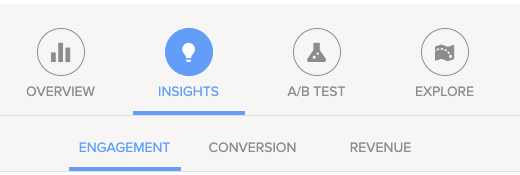
Engagement
Here you'll find metrics around how users interacted with your app in the days and weeks after they received your message. Metrics like average session length, retention rate, push opt-in/opt-out rates, and uninstall rates are all found here.
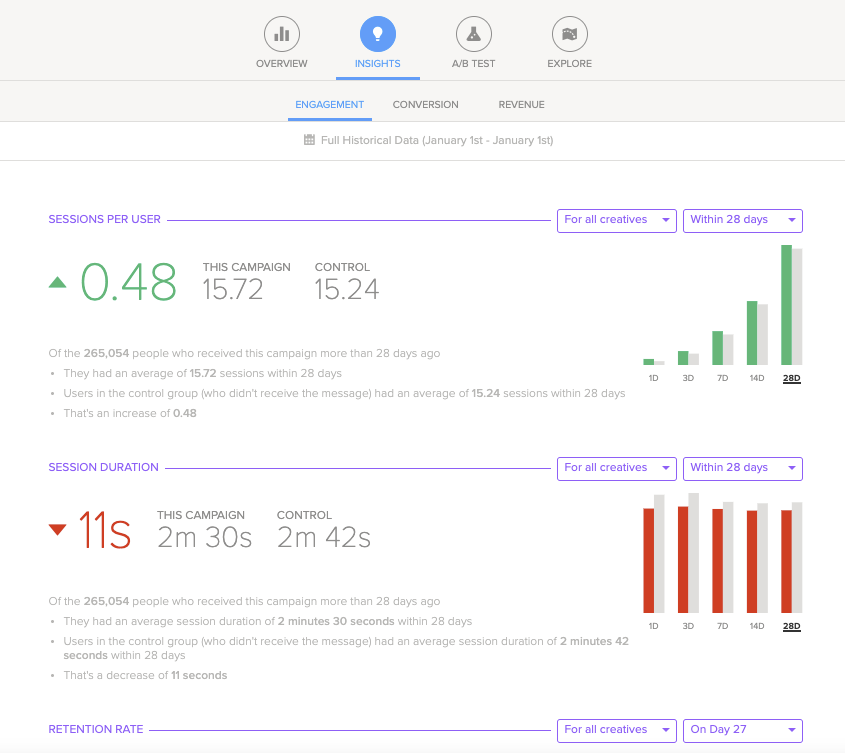
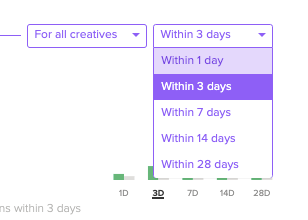
To filter any of these metrics, select the creative (if you decided to use the A/B testing functionality) and date from the drop-down list.
Note: For push messages, the metric Push Opt-Out Rate will be shown in the Engagement tab under Insights (since users receiving the message have already registered to receive push messages). When viewing the same tab for an in-app message, this metric will change to Push Opt-In Rate (since users may not be registered to receive push notifications).
Conversion
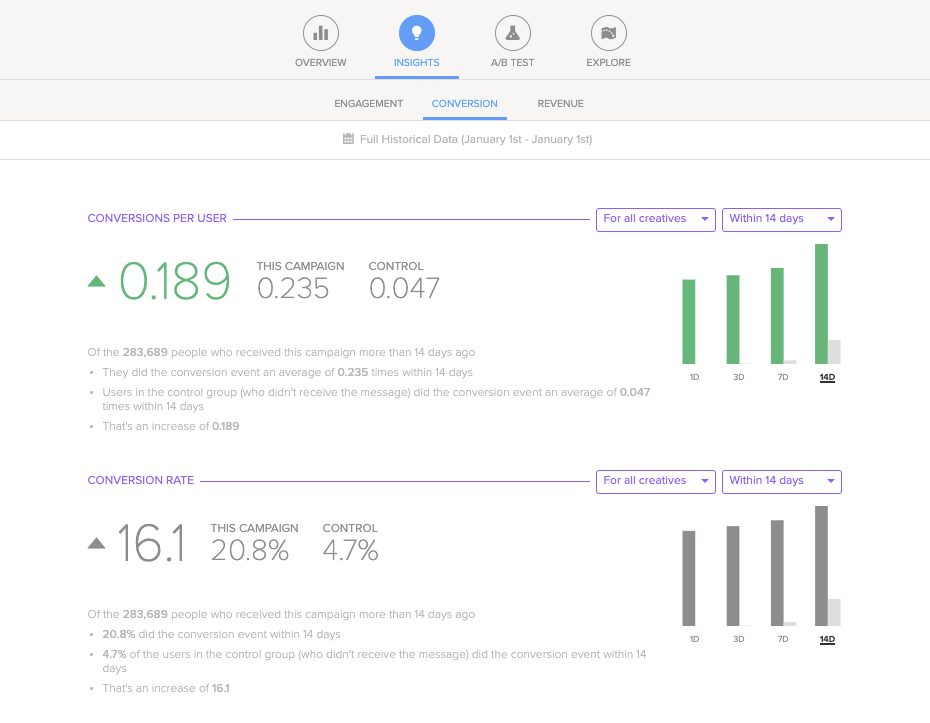
If you set a conversion event when you were building your message (highly recommended), this section provides details of how many members of the message's audience performed the conversion event, if they performed the event multiple times, and much more.
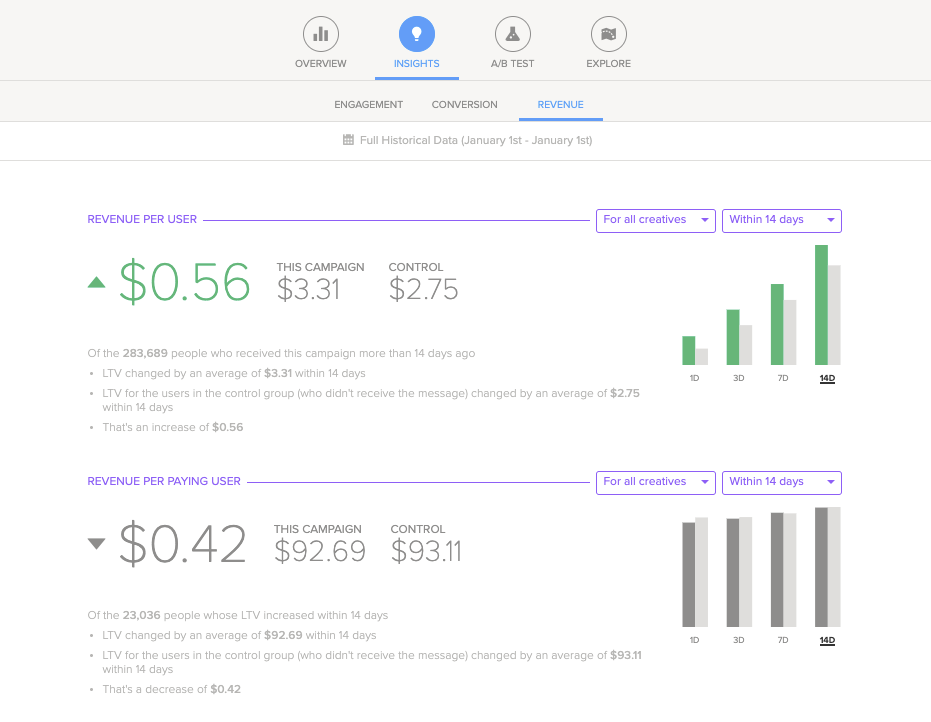
Revenue
If you have configured your event tracking to capture LTV, you’ll find detailed metrics on how your message drove changes in the LTV of users who received your messages.
A/B Test
If your message has multiple creatives, you can compare each version of the message side-by-side.
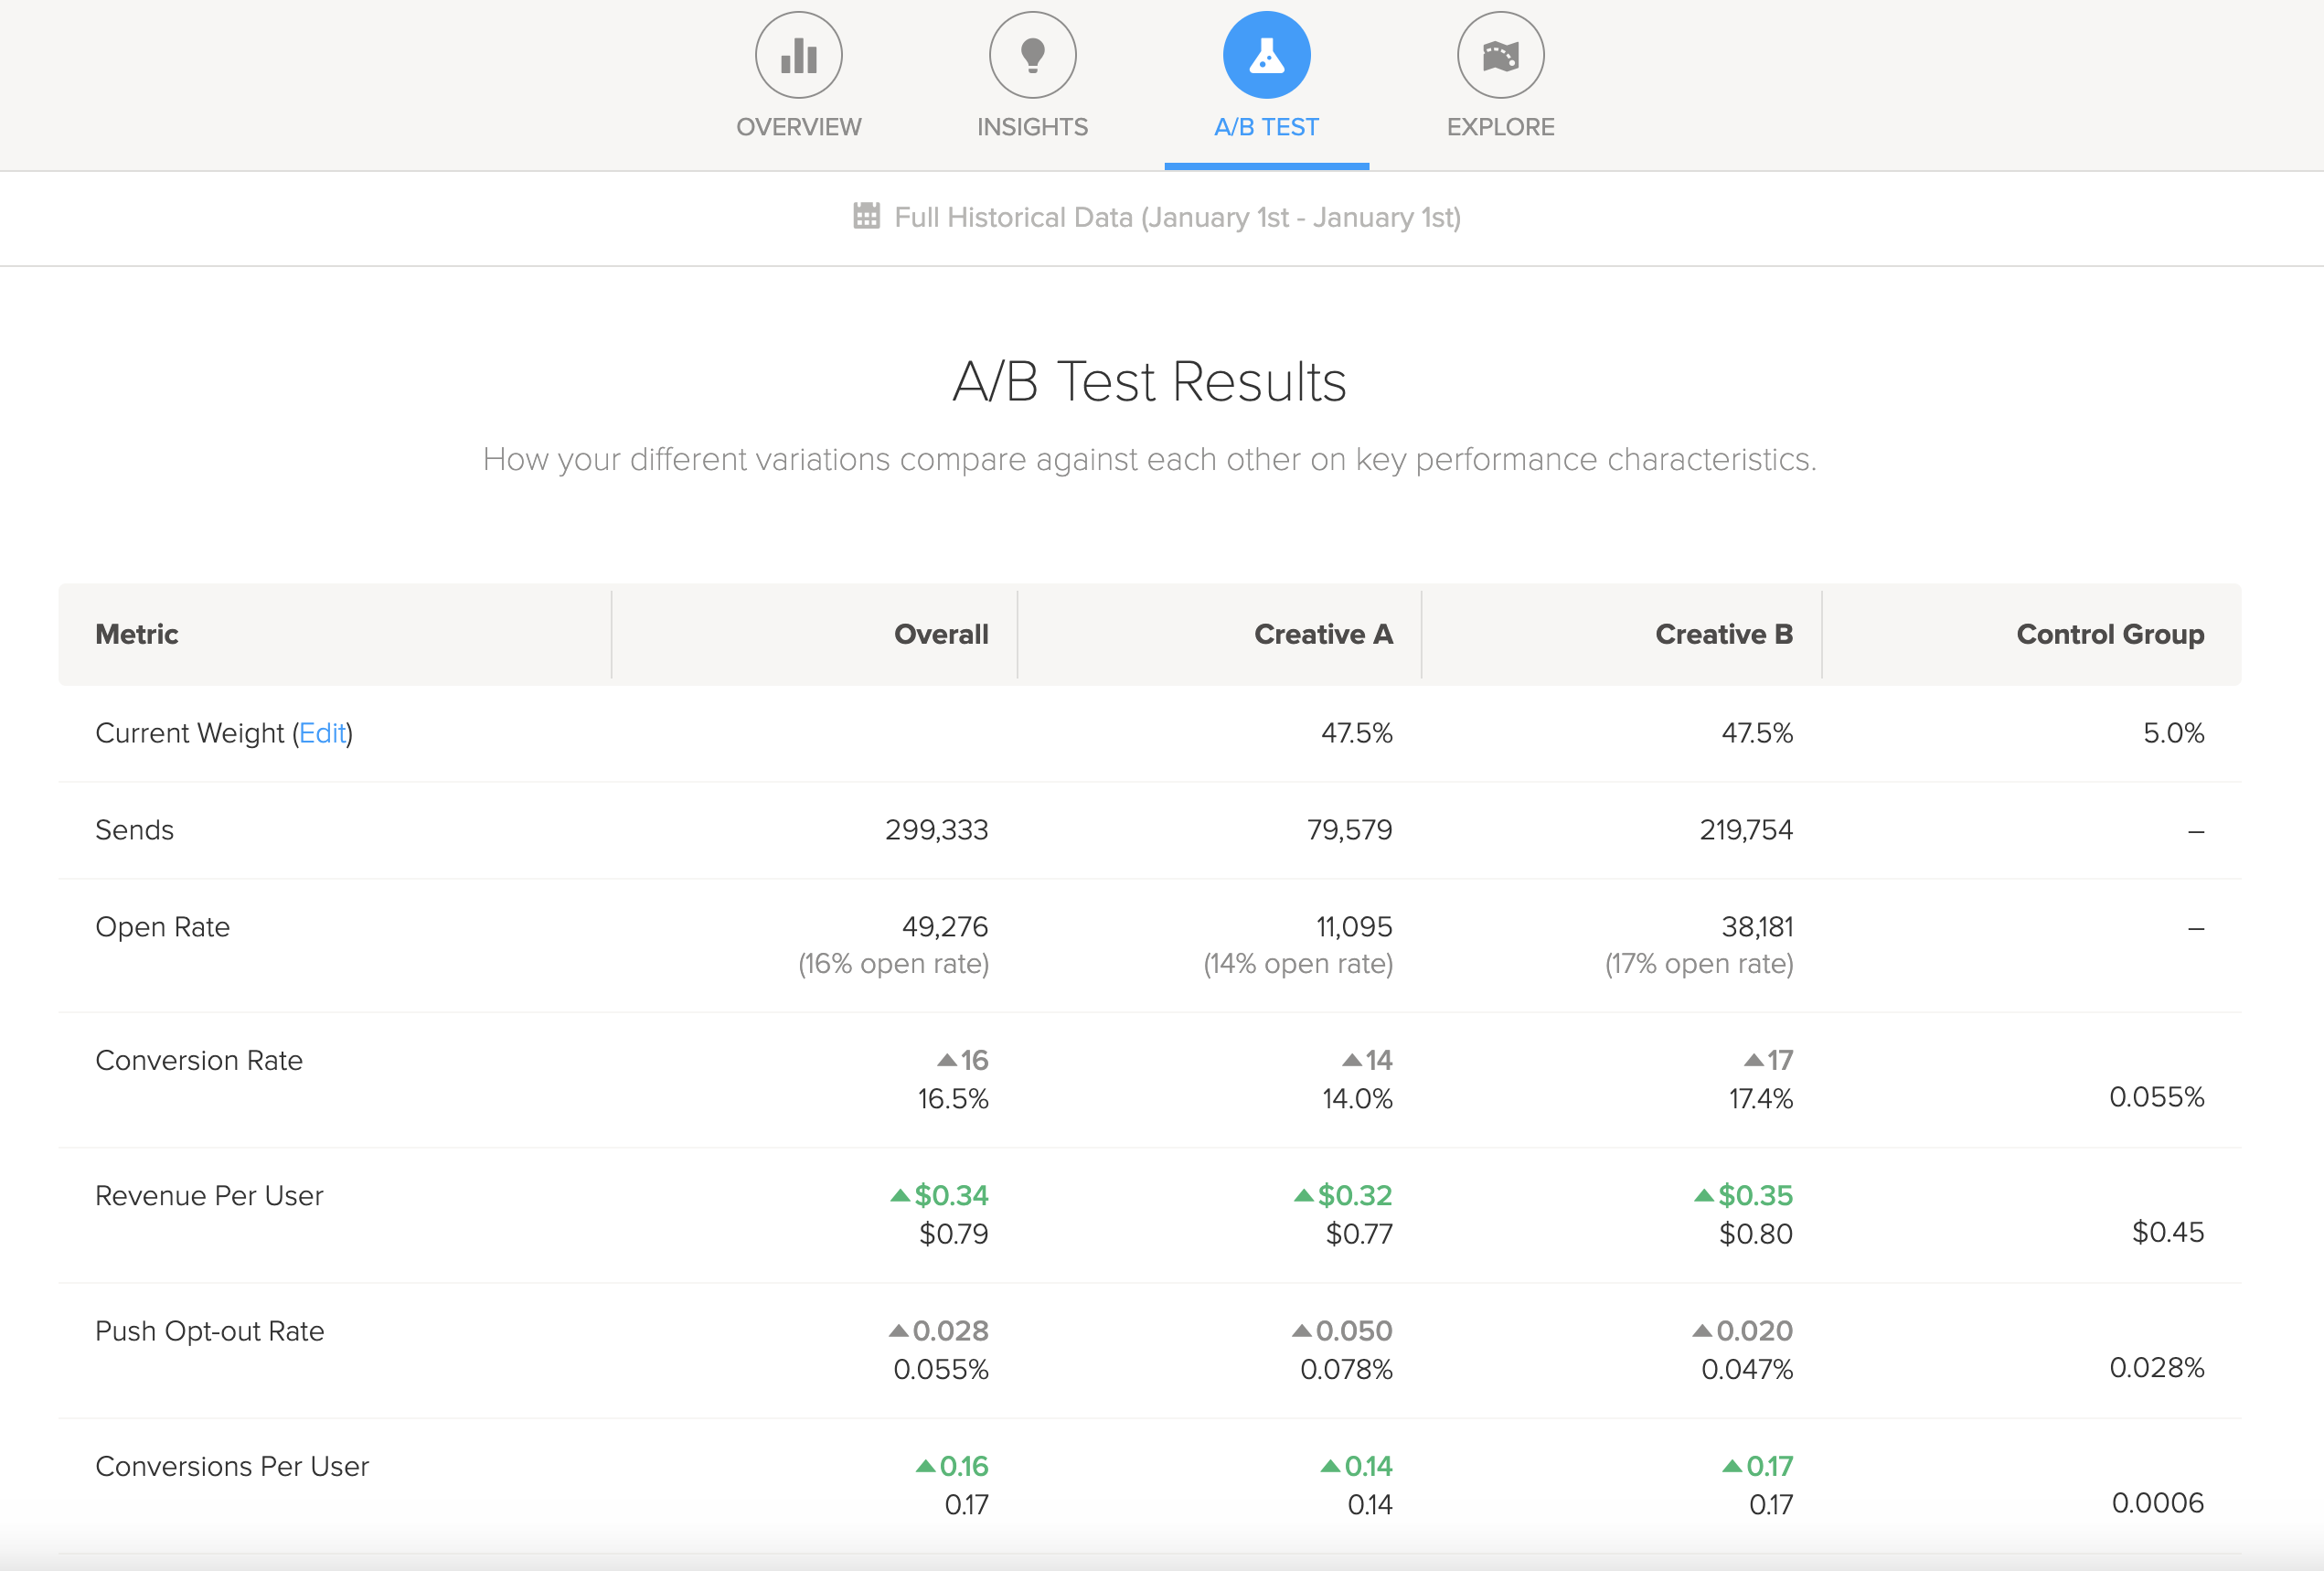
You can see how your creatives helped drive key metrics associated with the goal for your message, uncover which creatives are leading to adverse effects downstream, and compare how each creative performed against a control group. Use these insights to adjust the distribution of creatives to reflect the most successful version.
| Metric | Definition |
|---|---|
| Current Weight |
Percentage of the total audience the creative was sent to. |
| Sends |
Total number of sends per creative. |
| Open Rate | Total number of messages opened, divided by the total number of sends.* |
| Conversion Rate |
Total number of unique users who perform the conversion event within one day, divided by the total number of sends. |
| Revenue Per User |
Total amount of revenue change within one day, divided by the total number of unique users that received the message. |
| Push Opt-out Rate |
Total number of users who opt out of push notifications within one day, divided by the total number of unique users who received the message. |
| Conversions Per User |
Total number of conversion events performed within one day, divided by the total number of unique users who received the message. |
| Paying Users |
Total number of users who had a change in revenue within one day of receiving the message. |
* For in-app messages, an open is any "Localytics In-App Displayed" event that comes through with an "Action" attribute that is not equal to "X." For inbox messages, an open is any "Localytics Inbox Message Viewed" event that comes through with an "Action" attribute that is not equal to "X."
Explore
While you hope your users perform the conversion event in your message, you may want to see if your message has caused users to perform other actions as well. The Explore section lets you uncover insights for users who received your message and performed different behaviors.
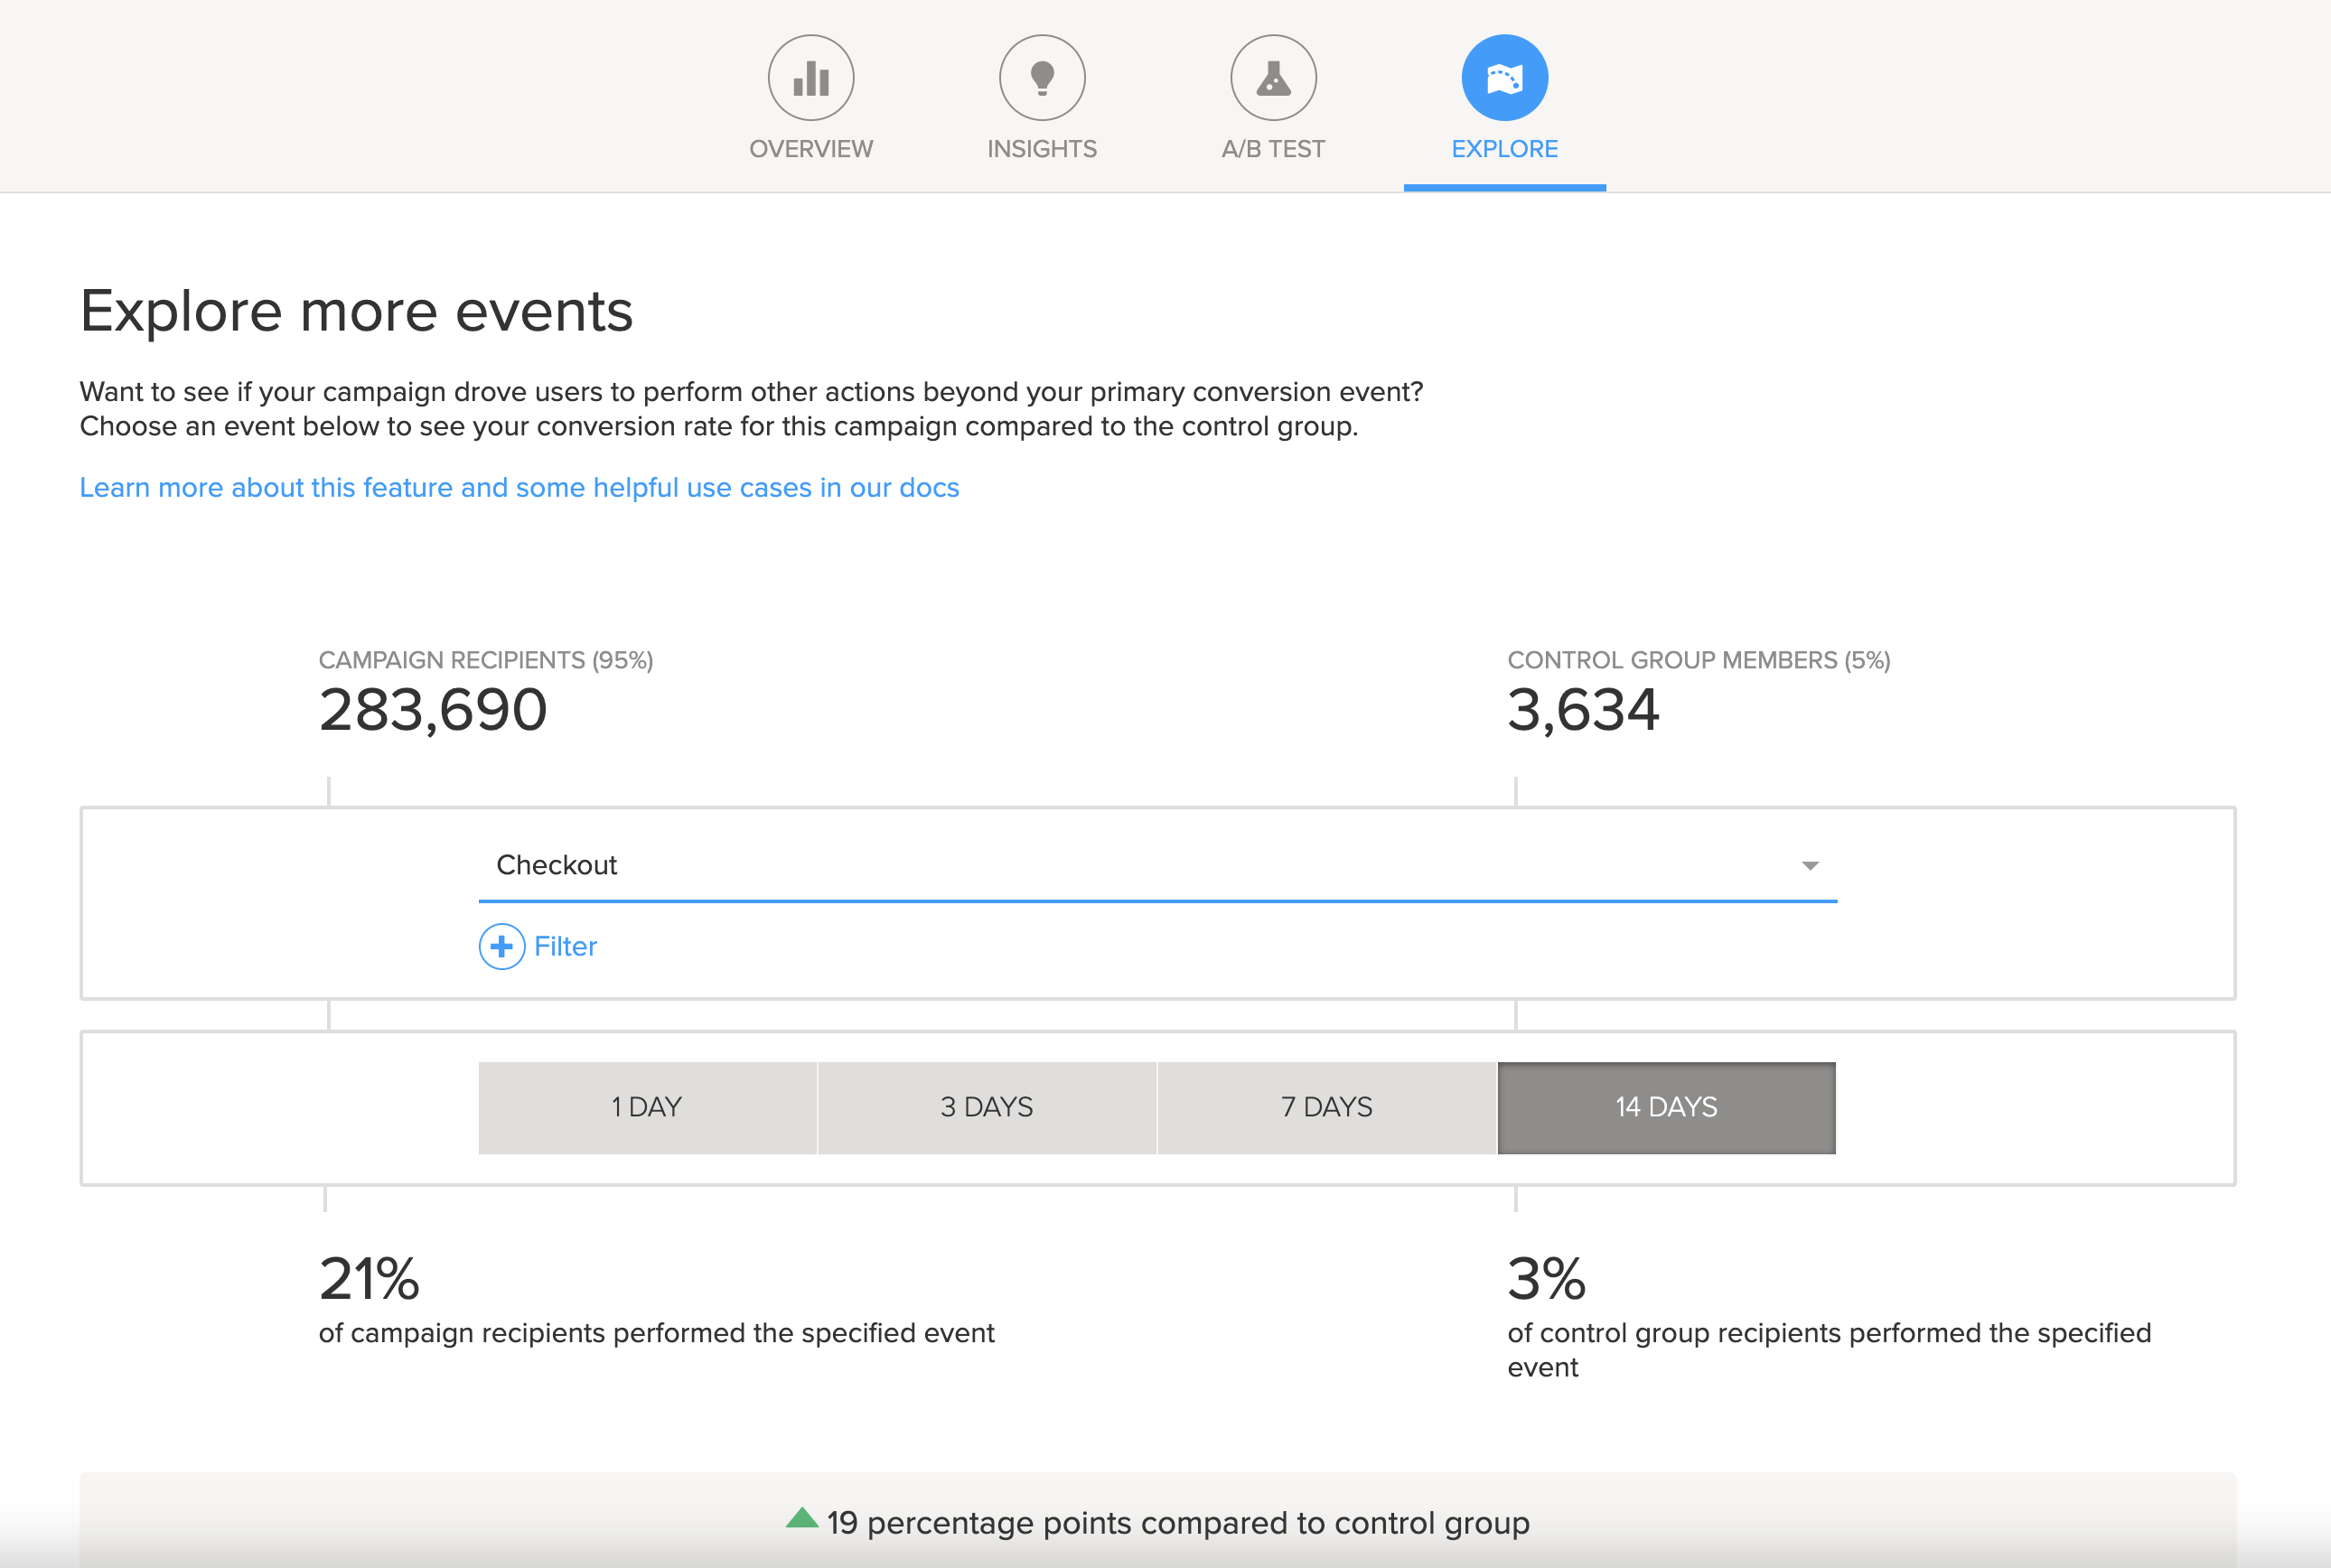
View other insights by specifying a different conversion event associated with message success. Alternatively, you could diagnose poor side effects of your message by selecting an event that could be considered the opposite of your conversion event.
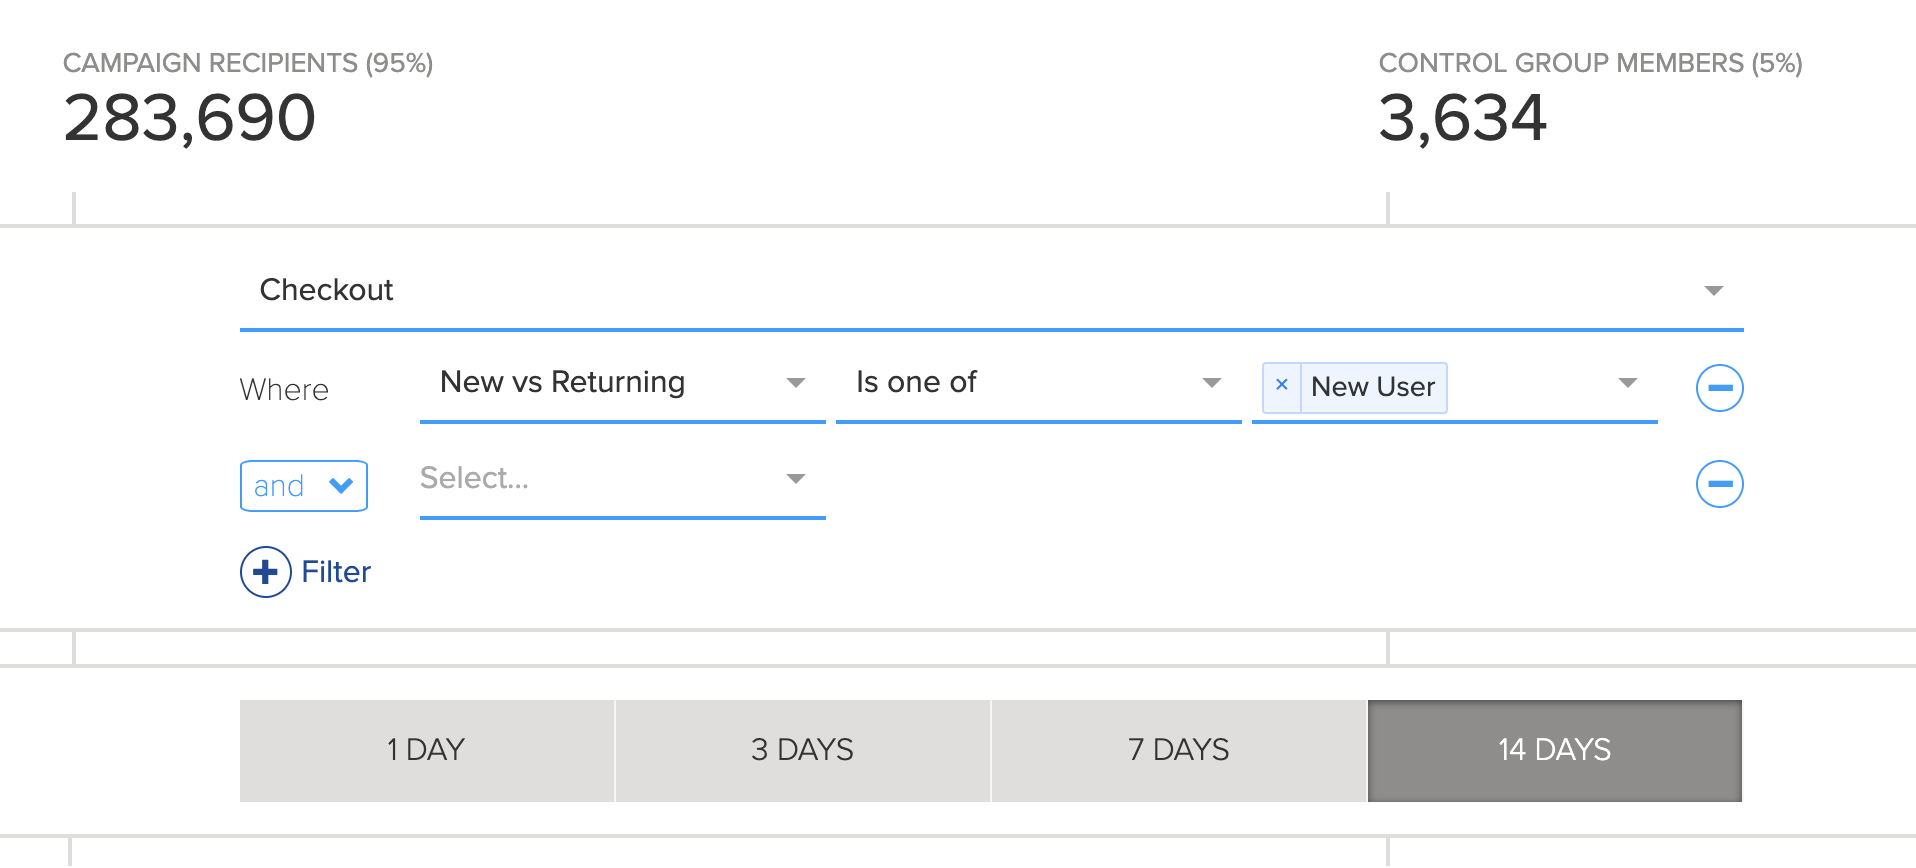
With Explore, you can see conversion rates for messages compared to the control group with four different time periods to choose from (1, 3, 7, and 14-day window). Toggle between the options to see the different time periods.
Explore also allows you to hone in on a subset of users by applying a filter to your conversion event. These filters can contain event attributes as well as custom dimensions. Use the + Filter option to add a filter.
